September 1, 2023
The unsung metric: Matthews Correlation Coefficient
TL;DR
For non-data practitioners: if you want a consistent AI model result in real life, do study Matthews Correlation Coefficient as an additional evaluation metric.
For data practitioners: if you are dealing with an imbalanced dataset and wish to better evaluate your model, Matthews Correlation Coefficient might pique your interest 👍🏻
Hòla 👋
My name is Rex and I will try to keep this article as non-technical as possible, to communicate more effectively with readers without a programming or data science background.
What are we trying to achieve?
The AI team at Revenue Monster has been working on a physical tampering detection problem across a set of sensitive documents. The goal: identify whether a document contains physical tampering or forgery traces. In effect, we’re building a physical fraud detection system on a set of images.
We introduced a two-stage deep convolutional neural network framework that could detect traces of physical tampering, and managed to obtain a high accuracy score of 95%. We were happy — until we received initial feedback from our client.
High fraud detection accuracy with a low false alarm rate
One of the main challenges in building a fraud detection system is procuring positive (fraud) samples. It’s very hard to find fraud samples across a data lake of otherwise legitimate ones. The fallout: a poor user experience for genuine users, since the classifier will inadvertently flag some legitimate transactions.
We worked through this by introducing more training data over time, revisiting our sampling approach, and investigating model penalization and evaluation more closely.
In the know
Now that our models were built, it was time to evaluate their performance properly.
We deployed our best model for client testing and the feedback we got was subpar.
The unseen testing examples carried new forgery variations. They introduced several refreshing forms of physical tampering, and our model was misclassifying them, despite the stellar 95% accuracy.
That’s when we knew we had to review our evaluation methods — be in the know.
The usual evaluation approaches
Accuracy, recall, precision, F-measure, TPR, FPR, Kappa…
Let’s take a slight detour and recap how practitioners from different domains evaluate their models:
- Medical sciences — Receiver Operating Characteristics (ROC), TPR, FPR
- Behavioral sciences — Specificity/Sensitivity, Cohen’s Kappa
- Computer sciences — Accuracy, precision, recall, F1, TPR, FPR
Scalar metrics are ubiquitous in the machine learning domain, and most familiar to data scientists. However, they are biased, and shouldn’t be used without a clear understanding of those biases and the corresponding base-rate level of the statistic.
In particular, let’s consider accuracy and F1-score with the classic Cat vs Dog Classification problem. F1-score is the harmonic mean of precision and recall.
- Accuracy works well when the class distribution is similar, while F1-score is a better metric when classes are imbalanced — as in our system.
- Accuracy is used when true positives and true negatives both matter equally, while F1-score is used when false negatives and false positives are what’s critical.
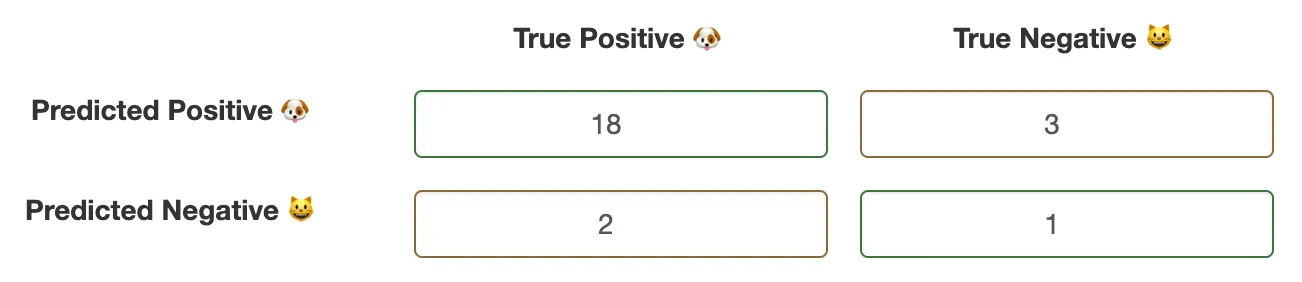
Say we have 24 samples in a confusion matrix, with only 4 cats against 20 dogs — clearly imbalanced. Computing the numbers gives:
- Accuracy — 79%
- Precision — 86%
- Recall — 90%
- F1-Score — 88%
An 88% F1-score looks fantastic. Are we ready to ship this classifier to production? What happens if we flip the confusion matrix — does the F1-score hold up?
Sure enough, the F1-score plummets to 29%, and the classifier turns out to be awfully bad at classifying cats. Notice that accuracy hasn’t changed at all, still sitting at 79% — which raises the question of how reasonable a measure it really is.
Here’s the fix: Matthews Correlation Coefficient
The scalar metrics above aren’t always suitable for imbalanced dataset scenarios, such as fraud detection. Enter Matthews Correlation Coefficient (MCC), also known as the phi-coefficient (φ).
Surprisingly, MCC is hardly discussed in most data science materials or graduate programs. Our team learned about it the hard way, and I hope this saves someone else the trouble.
In short, MCC measures the quality of a binary or multi-class classifier even when the classes are of very different sizes. It returns a value between -1 and 1, where:
- -1 — total disagreement between prediction and observation
- 0 — no better than random prediction
- 1 — perfect prediction
Coming back to the Cat vs Dog example above, we get an MCC score of 0.169 — telling us the classifier is no better than random and the classes are weakly correlated, despite the high 79% accuracy score.
Unlike F1-score, which ignores true negatives, MCC accounts for all four values in the confusion matrix, so all classes are treated equally. Flip the confusion matrix, and MCC gives you the same result either way.
Implementation
MCC is already implemented in scikit-learn for both binary and multi-class classification problems — no need to build it yourself.
Finale
MCC helped our team properly evaluate our trained model, and from there we were able to quickly tune parameters and improve results.
No single metric is better than another — it always comes down to understanding your data’s underlying distribution and picking metrics that match the problem you’re actually trying to solve.